Query History
On the Query History page, you can see a log of all messages sent to Onyx. This includes messages sent to the Slack bot and through API keys.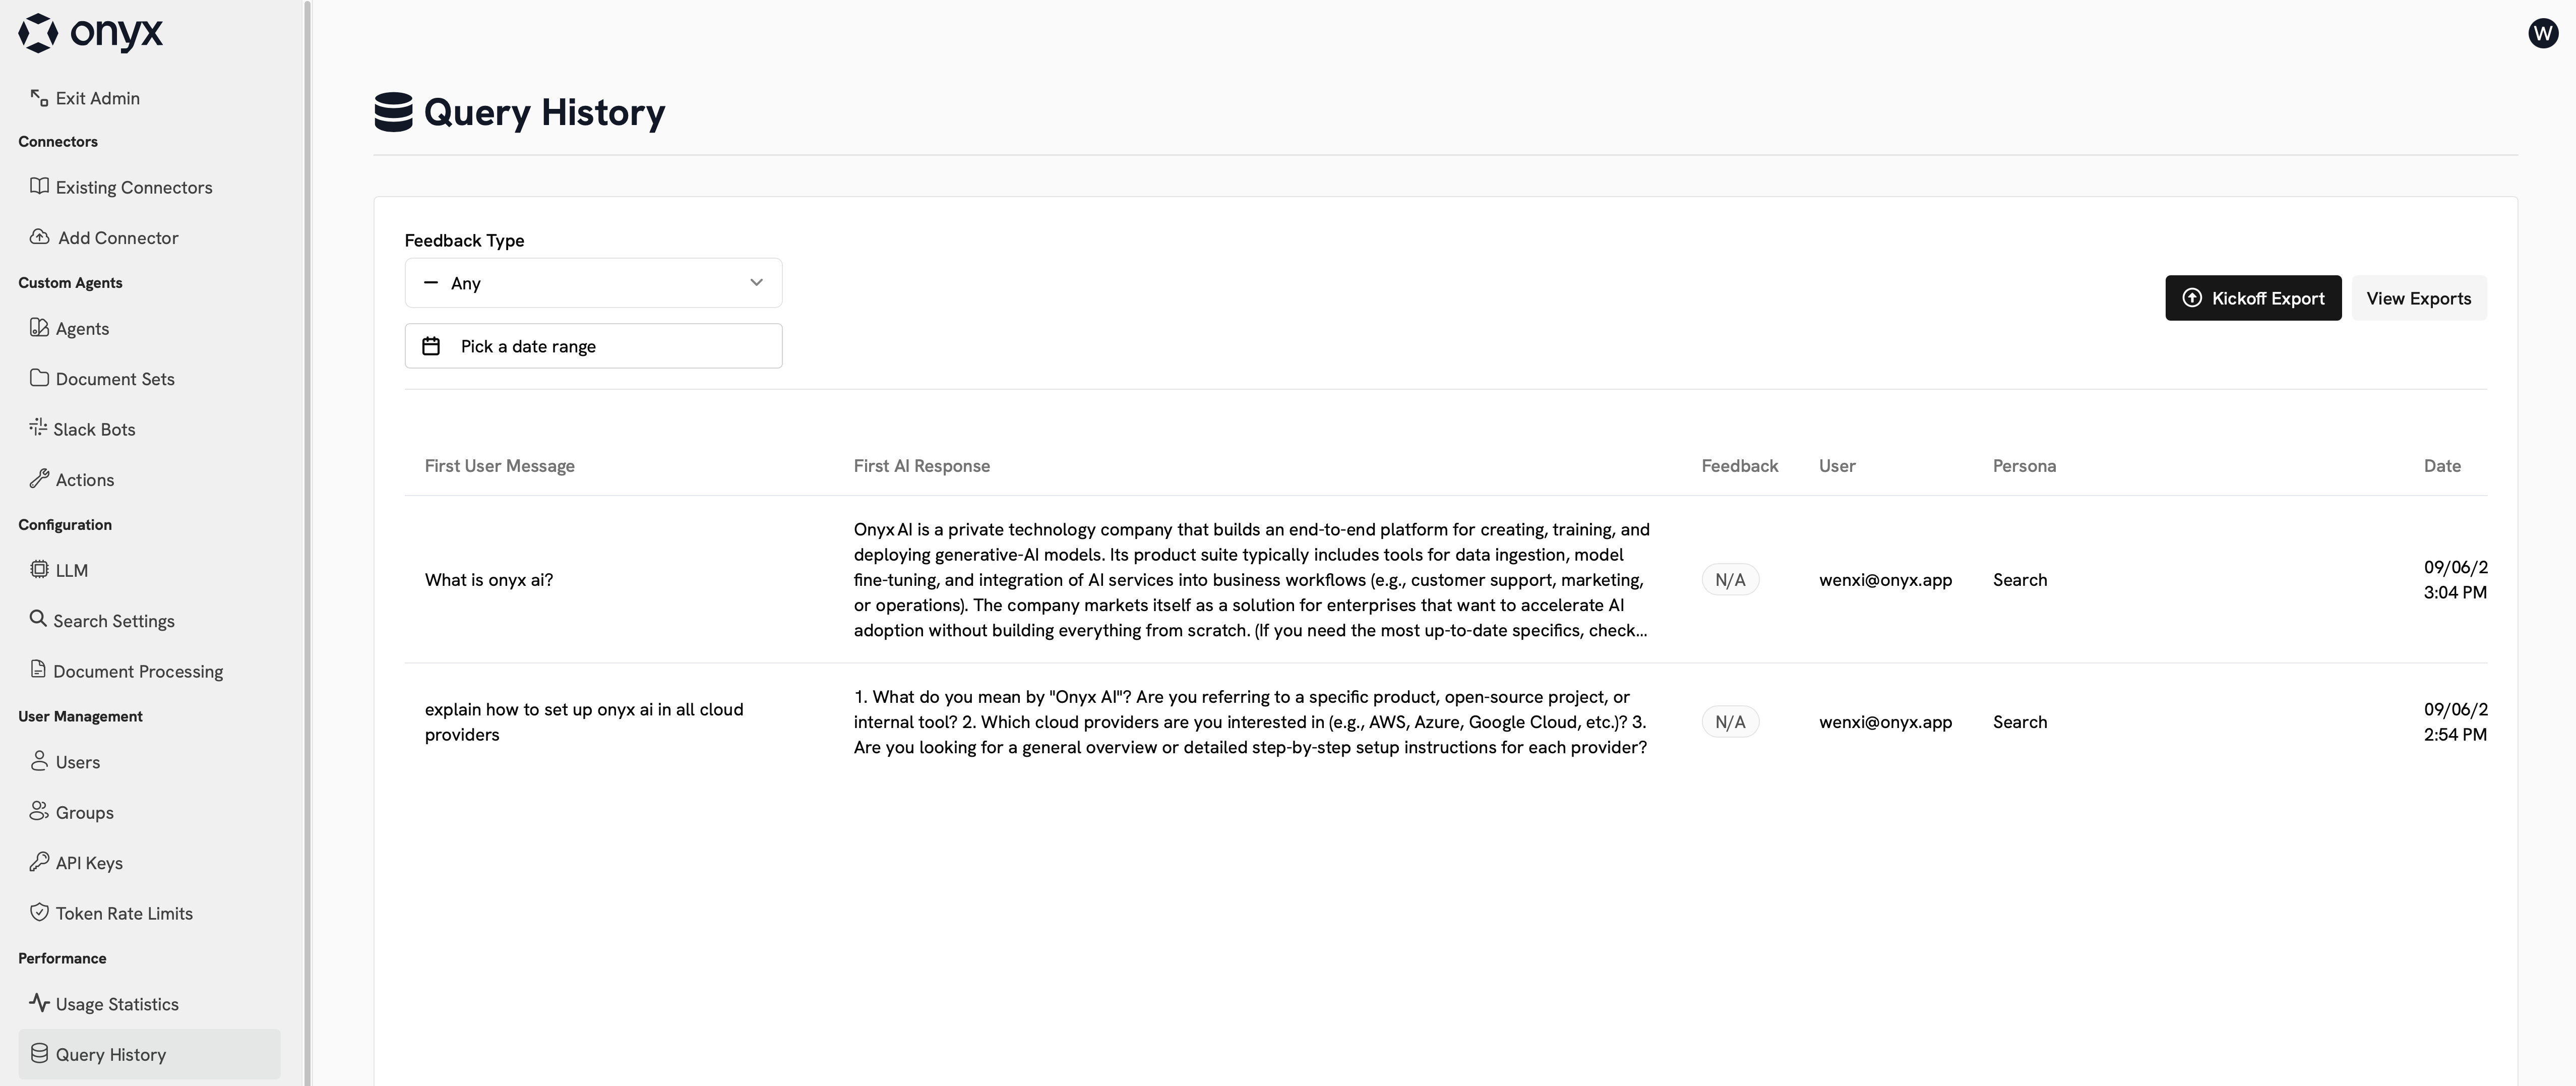
Exporting Query History
You can export your query history to a CSV file. This export can be time consuming depending on the size of your query history.Usage Statistics
On the Usage Statistics page, you can see a summary graph of the active users and number of queries sent to Onyx. Additionally, you view the thumbs up and thumbs down feedback your users are giving their AI answers.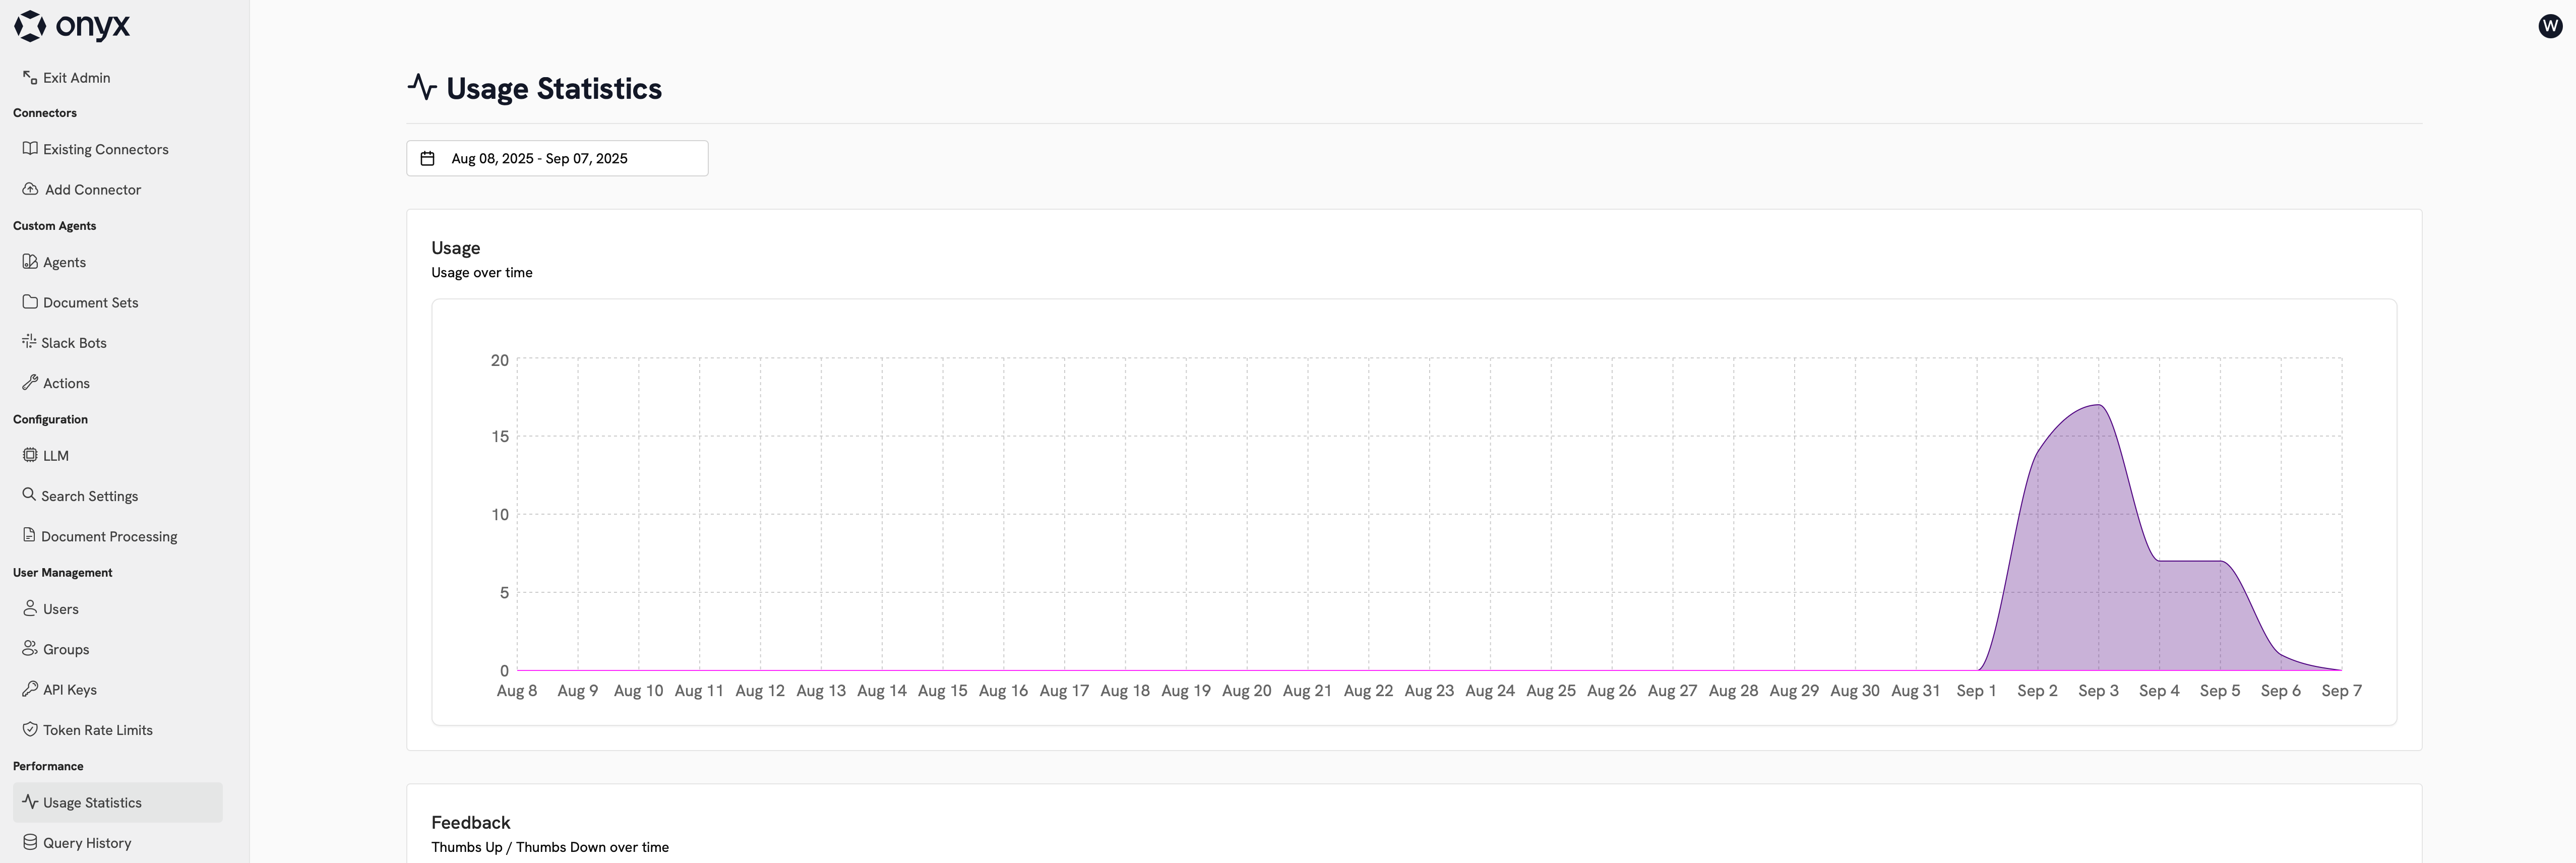
Custom Analytics
Onyx Enterprise Edition allows you to configure a custom analytics provider.1
Set the CUSTOM_ANALYTICS_SECRET_KEY environment variable
Set the
CUSTOM_ANALYTICS_SECRET_KEY environment variable to some random string.
Make sure you have the value saved temporarily somewhere.Re-deploy Onyx.2
Go to the Custom Analytics tab in the Admin Panel
Go to the Custom Analytics tab in the Admin Panel.
3
Enter in the Javascript snippet provided by your Analytics provider
This snippet would normally be placed within the
<head> tags at the base of your project. For the Secret Key,
use the value you saved in Step 1.The
<script> tag MUST be removed before being copied into the text box.